USING THE MEASUREMENT’S METHOD OF THE REFLEXIVE REPRESENTATIONS IN CROSS-CULTURAL RESEARCHES
This paper has been presented on the XXIX International Congress of Psychology, Berlin, 20-25th July 2008
Khromov A.B., Basimov, M.M., Russia
Abstract
Method of multilevel reflexive measurements of cultural peculiarities, minimizing mistakes of etic methods is suggested. The assessment performed in three levels - as mutual direct, as own mutual reflexive, and as mutual reflexive representations from the standpoint of other cultures' subjects. Method was applied in cross-cultural research of Russia, India and USA. Multiple pair comparisons of "parameter-group” relations for thirty six estimations based on Student’s criterion are transforming in continuous scale with reference frame common for all measurements - zero point of comparative ponderability and are geometric representing their attitudes in space of cross-cultural assess.
The results of cross-cultural comparisons on direct evaluation are often unsatisfactory. Many ethnical psychologists and cultural anthropologists (D. Berry, D. Matsumoto, G. Triandis, F. Khsyu, T. Stefanenko, N. Lebedeva, and others) consider it to be impossible to find adequate indices for comparing cultural variables since each culture represents a complete and unique world.
Reflexive estimation of the subject from different positions allows to discover the characteristics of the subject’s reality more generally and more objectively. We used the reflexive approach to estimate the different cultures’ peculiarities, which allowed us to minimize the excessive ethnocentrism of the persons being tested. Currently reflexive methodology is being increasingly used as a means of reflexive analysis of psychological facts (V.Lefevr, G.Shchedrovitsky, V.Lepsky and others). Reflection displays secondary images, and gives a chance to see the world differently than just from the direct point of view. The procedure of "two mirrors” can be the prototype of the reflexive approach.
The points of view of the subject - it is the positions of subject’ reflexive representation. Students collective representations were studied on three levels of reflection (0, 1, 2). The zero level of reflexive reflecting are the direct estimations of the particularities of self culture and particularities of the other cultures. The first level of reflection measuring – the point of view of the other representatives of the same ethnos. The second level of the reflexive representation – a frequentative reflection of some particularities of the culture with standpoint of the representatives of the other culture.
For estimation of the cultures was used cultural-estimated differential, developed by G.Soldatova and at al., adapted by A.Khromov for the multilevel reflective estimation of cultures on the parameters of the group valued orientations: on group, on power, on each other, on social change.
For three ethnic groups as a result of cross measurement we have 36 direct and reflexive estimations of the first and second levels. The estimations are divided in three groups depending on that what culture [russian (R), american (A), indian (I)] is valued. In the denotation of estimation of NXYZ entered for further description four positions have a following sense: N is a level of reflection (0, 1, 2); X – who estimates (R, A, I); Y – who is estimated (R, A, I); Z – from whose point of view estimate (R, A, I). In every group (one column) have 12 estimations: for four estimations from the side of each of three studied cultures: one direct estimation (marked on position of Z character of «*») and three reflection estimations from point of each of three cultures. For example, 0IR* is a direct estimation of the Russian culture by Indians, 2ARI is a reflection estimation of the Russian culture by Americans from position of Indians.
M.Basimov’s statistical method of the multifactorial comparison of psychological data and examinee groups was adapted. One-factor analysis of variance (ANOVA) researches one factor, which has J levels. N independent observations are taken on each of J of levels. The researcher expects that n observations on each level are independent and take from normal collection with dispersion . It is supposed that dispersion alike on all J level. The conclusion of one-factor analysis of variance (ANOVA) – a statement about that that zero-hypothesis about absence of difference between selective averages true or false for corresponding to value level (а=0.05 and others.). If zero-hypothesis is rejected, that approving the type «not all averages are possible to consider equal» often not too informative. In contrast with simple statement that selective averages are different, in the absence of statistical conclusion this, of course, a feather in your cap, but the decision to reject the zero-hypothesis tells nothing about what considered averages are different. Methods of the plural comparisons are intended for use after rejection of zero-hypothesis ANOVA about absence of difference. The target of these methods consists in separation of the comparisons between average, regard-giving to casting-out zero-hypothesises. Methods of the plural comparisons (the most known of the plural comparisons is designed J.Tukey and G.Sheffe: T-method and S-method) are logical continuation of the analysis of variance and result in or information about presence of difference within the framework of each pair of selective average Xi and Xj, tells nothing about the general picture of the distribution of selective average (T-method), or estimation of value of the contrast, not offerring methods of the formation (S-method).
The studied D(N,M) data matrix of the reflexive research consists of S (the amount compared direct and reflexive groups of estimations, forming collection from N estimation on each parameter) blocks by dimensionality NixM, where M – an amount of measured parameter for each estimation, but Ni – an amount estimation in each of S compared groups of estimations (who estimates, who is estimated, with whose standpoint value). The quantitative feature of the plural comparison is a matrix of comparative weightiness V(M,S), with use which it is possible to build the different evident distributing of groups of estimations and studied parameters, reflecting the result of plural comparison. The matrix element Vij defines comparative value of i-parameter for j-groups of estimations. The matrix «Comparative weightiness – I» is built as a result of benchmark analysis considered the ensemble of the groups of estimations within the framework of each diagnosed psychological parameter. The realization of the algorithm for one factor gives the line of the matrix comparative weightiness. The demonstrative representation of the result of the plural comparison is built in the manner of distribution on level of the reliable difference of the studied groups of estimations within the framework of each of diagnosed parameter. For realization of the plural comparison of the group of estimations, formed on the grounds of external criterion (who estimates, who is estimated, with whose standpoint value), are compared alternately on all diagnosed parameter with index from 1 before M. Within the framework of each parameter for all possible pair of the groups of estimations (whole S(S-1)/2 pairs for S compared groups of estimations) is conducted comparison with use of statistical Student criterion. Coming from test estimation calculate average values Xij and average quadratic deviations Yij on each measured parameter (i takes values from 1 before M) for all considered groups of estimations (j takes values from 1 before S). Inwardly each of M considered parameter are compared in pairs all from S chosen groups of estimations. When finding reliable difference for parameter i, is revealed how much levels of the reliable difference of the studied groups of estimations there is within the framework of considered parameter. Distributing of groups of estimations on levels is made so. The Student criteria are calculated for all possible pairs of the groups of estimations within the framework of each parameter i (i takes values from 1 before M):
where g and j – a number of the compared groups of estimations.
Whereupon the calculation values of the criterion are compared with critical values of the Student criterion, for instance, for the level of value а=0.05. Using a table of the theoretical Student distribution stand out the pairs of the groups of estimations, for which exist the reliable difference group average for the considered parameter i.
For each of compared groups of estimations j is revealed how much groups of estimations B(j) has a value of the parameter i statistically smaller, and how much groups of estimations A(j) has value of the parameter i statistically greater, than value of this parameter for groups of estimations j. It is calculated the difference B(j)-A(j), showing insofar more groups of estimations is found below given groups, than above, by comparing S groups of estimations and revealled herewith reliable difference between them. Minimum value of the difference B(j)-A(j) corresponds to the lower level – the first, maximum value – a high level. The amount level obviously changes from 1 before S for the list from S compared groups of estimations.
Values B(j)-A(j) can be as positive, so and negative, changing in the interval from 1-S before S-1. Value 1-S corresponds a case, when value of index of i for the group of estimations of j for certain less than, than for all of other studied groups of estimations, and value S-1 – if more than for all of other compared groups of estimations. In matrix representation after calculation of all T-criteria for the next parameter have a matrix of T-criteria T(S,S). From the matrix of T-criteria as a result of matrix element comparisons T(S,S) corresponding to each element of the matrix by critical values go to the matrix difference between S considered groups of estimations O(S,S), which elements take three values: -1, 0, +1. If Oij= 1, that group of estimations i has value of the considered parameter statistically greater, than group of estimations j, if Oij= -1, that group of estimations i has value of the considered parameter statistically smaller, than group of estimations j and, finally if Oij= 0, in this case, when is absent the reliable difference between groups of estimations i and j on considered parameter.
Now to get the line of the matrix of comparative weightiness (VES), corresponding to considered parameter, it is necessary to lay down all of the columns of the matrix of differences for this parameter. Or in the other way, every element of the matrix of comparative weightiness Vij is defined the index i:
On this algorithm 36 mutual direct and reflexive groups of estimations (within the framework of each parameter) are distributed on levels, which are characterized by calculated comparative weightiness of the parameter for considered groups of estimations. Moreover amounts of comparative weightiness of all groups of estimations for each examined parameter are equal to zero.
To reveal the sense of the got values (the comparative weightiness), characterizing differentiating groups of estimations within the framework of separate parameter, was considered row of model examples [1], in which are presented conditional groups, between which exist the reliable differences.
Let’s take as an example of the limiting case, when for any of pair of the examined groups there is a reliable difference. Let’s take the collection from poles of the groups. The matrix of difference in this case has zeroes on the main diagonal only. The groups (the line of the matrix) take place for clarity in order of the decrease comparative weightiness (in the first line – a change from the other groups for the group with maximum average, in the sixth line – a change from the other groups for the group with minimum average):
Matrix of differences for six groups: in all 15 pairs group authentically differ from each other. Compared groups of all nearby levels has a reliable differences, at difference in comparative weightiness for nearby level is 2.
We shall note that to regularize the groups only on average values (as is it sometimes done in the analysis result) is a blunder since compare two averages possible only in term of the reliable difference with provision for dispersion and volumes of the samples. Possible note that on one level are always found groups, not having reliable difference between itself, but amount of the compared groups must be limited from below. Quantitative value of comparative weightiness is broken, when value of the parameter in one group (two groups) statistically more (less) than in majority of the considered groups moreover, between themselves these groups have no reliable difference. Such result is possible to interpret or as presence person (exclusive) of the groups, not to look like others that is expressed in big modulo comparative weightiness, or interpret these weightiness as ordinal values.
The matrix «Comparative weightiness – II» of orthogonal plan in relation to the first variant built coming from need of the representation of results in the type of the distribution on levels of studied parameter within the framework of each group of estimations. This variant of plural comparison can be described as non-obvious in relation to the first variant, because in spite of calculations with representation of information as distributing on the levels of the diagnosed parameters within the framework of every group of estimations taken (unobviously, through standardization of information on all of great number of the examined groups of estimations) into account and differences of groups of estimations between itself within the framework of the diagnosed parameters.
The Matrix «Comparative weightiness – III» (generalised variant) is built as a result of benchmark analysis element direct product of considered ensemble of the groups of estimations and diagnosed parameters. The elements ensemble, being direct product ensemble chosen for study of the groups of estimations and diagnosed parameters, shall mark as follows: P$/N$, where P$ – diagnosed parameter, but N$ – a group of estimations. These elements P$/N$ in our event will be M*S (M parameters and S groups of estimations).
Since in this instance necessary to compare samples between themselves, referring as to one and same diagnosed parameter, so and to different diagnosed parameters, necessary primary test estimations to convert in standard T-balls (for collection of considered groups of estimations):
,
where i takes values from 1 before N (N – an amount estimation in the aggregate, uniting all considered groups of estimations), a j – from 1 before M (M – an amount diagnosed parameters); mj – an average importance, but dj – an average quadratic deviation for the parameter with index j, computable on the whole considered data base, presented by S studied groups of estimations.
The demonstrative representation of the result of the plural comparison is built in the manner of distribution on level of the reliable difference all M*S element P$/N$ (P$ – diagnosed parameter, but N$ – chosen group of estimations).
Elements P$/N$ direct product ensemble of groups of estimations and diagnosed parameters are compared between itself (the plural comparison) for all possible pairs P$i/N$j and P$m/N$k, where i and m take values from 1 before M, but j and k – from 1 before S (whole M*S(M*S-1)/2 different pairs P$/N$ for M diagnosed parameters and S groups of estimations). The comparison is conducted with use of the Student statistical criterion.
Coming from the standardized estimation of calculated average values Xij and average quadratic deviations of Yij on every measureable parameter (i takes on values from 1 to M) for all of the set groups of estimations (j takes on values from 1 to S ).
Having M*S average values Xij (and as much as average quadratic deviations of Yij), shall conduct their plural comparison. All of elements of P$/N$ of direct work of great numbers of the selected groups of estimations and diagnosed parameters are compared in pairs. At finding out reliable differences between the elements of P$/N$ of direct work of great numbers of the selected groups of estimations and diagnosed parameters how many levels of reliable difference come to light it will be got for them.
Distribution of the elements P$/N$ on the level is produced so. Student criteria are calculated for all possible pairs of elements P$/N$ direct product ensemble groups of estimations and diagnosed parameters on the formula:
,
where m and n take values from 1 before M*S: m=S*(i-1)+j (i changes to 1 before M, j – from 1 before S), n=S*(g-1)+k (g changes from 1 to M, k – from 1 to S).
Whereupon design values of the criterion are compared with critical values of the Student criterion for level of value, for instance, а=0.05. Using table of the Student theoretical distribution stand out that pairs an element P$/N$ direct product ensemble chosen groups of estimations and diagnosed parameters, for which exists the reliable difference of their average values.
For each element P$/N$ (whole M*S) of the direct product ensemble groups of estimations and diagnosed parameters are revealled how many elements P$/N$ B(i) have values statistically smaller and how much elements P$/N$ A(i) have values statistically greater, than element P$/N$ under number i (i takes values from 1 before M*S). It is calculated the difference B(i)-A(i), showing insofar more elements P$/N$ are found below given element P$/N$ with index i, than above, by comparing M*S elements P$/N$ and revealled herewith reliable difference between them. Minimum value of the difference B(i)-A(i) corresponds to the lower level – the first, maximum value – a high level. The amount level obviously can changes from 1 to M*S for list from M*S elements P$/N$ direct product ensemble studied chosen groups of estimations and diagnosed parameters.
The values B(i)-A(i) can be as positive, so and negative, changing in the interval from 1-M*S to M*S-1. The value 1-M*S corresponds to mate, when element P$/N$ with index i all other elements P$/N$ less in size got list, but importance M*S-1 – if more in size all rest elements P$/N$ direct product ensemble groups of estimations and parameters. In matrix representation after calculation all T-criterion has a matrix T-criterion T(M*S,M*S). From matrix T-criterion as a result of matrix elements comparisons T(M*S,M*S) corresponding to for each element of the matrix by critical values go to matrix of difference between M*S considered elements P$/N$ O(M*S,M*S), which elements take three values: -1, 0, +1. If Oij= 1, that element P$/N$ with index i has importance statistically greater, than element P$/N$ with index j, if Oij= -1, that element P$/N$ with index i has importance statistically smaller, than element P$/N$ with index j and, finally if Oij= 0, this event, when is absent the reliable difference between elements P$/N$ with index i and j.
Now to get consecutively on lines all elements matrixes «Comparative weightiness» (VES/OB), necessary to pack all column of the matrix difference. Or, on the other, element of the matrix «Comparative weightiness» Vij is defined as amount elements S*(i-1)+j – line of the matrix difference O(M*S,M*S):
,
n g=1
We shall notice that in this case (unlike two previous) zero is only amount of comparative weightiness of all M*S elements P$/N$ direct product.
For analysis the matrix of difference O(M*S,M*S) is possible to present in two types, depending on that select we blocks on groups of estimations or on psychological parameters. I variant of the representation of the matrix difference: blocks (whole M*M block) by dimensionality (S*S) are formed from the numerical features difference (-1; 0; +1), referring to one of the pairs of the parameters. II variant of the representation of the matrix difference: blocks (whole S*S block) by dimensionality (M*M) are formed from the numerical features difference (-1; 0; +1), referring to one of the pairs of the groups of estimations.
For use comparative weightiness in accounting model such form to information sufficient. But for interpreting, understanding the sense to proposed information, the relationship with distribution on the first two algorithms of the building of the matrix of comparative weightiness is reasonable do the samples from distribution of M*S object on sign relations between them or to one of considered groups of estimations, or to one studied parameter.
In the considered cross-cultural study with use of the procedure of the study of ethnic particularities through the measurement of the cross collective reflexive representations, at ensemble direct and reflexive estimation (the pairs «estimation – a parameter of group value orientation») – 36 estimations on 4 parameters and use the method of the plural comparison for all ranked pairs «group of estimations – a parameter» maximum and minimum value of comparative weightiness were got following:
VES/max=143 and VES/min= -132. Beginning and end of the distribution of the pairs:
Choosing from pairs «estimation – a parameter of group value orientation» the pairs, referring to one studied parameter, shall get distribution on the level of comparative weightiness 36 estimations, referring hereto parameter. These 36 direct and reflexive estimations are divided on three groups depending on that what culture (russian, american, indian) is valued. For example we shall bring such table for parameter «Loyality to Judicial System (law):
We shall remind that in indication of the estimation NXYZ four positions have a following sense: N is a level of reflection, X – who estimates, Y – who is estimated, Z – from whose point of view estimate (a direct estimation is marked on position of Z character of «*»); but headline in table S/V – comparative weightiness.
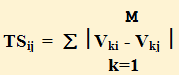
Hereinafter for study of the discrepancy of the spectrum direct and reflexive estimation preferred to go from consideration of estimation within the framework of each studied parameter to consideration these estimation on ensemble of all parameters. The tensor of the groups of estimations TS(S,S) describes the integral comparison of the groups of estimations on ensemble studied parameters (gr, ch, int, law). The tensor of the groups of estimations presents the symmetrical square matrix TS(S,S) to dimensionality S*S (S lines and S column). The matrix element, pertaining to line i and column j, gives the numerical feature «distances» between groups of estimations under number i and j in space studied parameter, presented in covectors of comparative weightiness, determined for closed ensemble of the considered groups of estimations.
The components of the tensor of the groups of estimations TSij are calculated as follows: sum absolute values of the differences elements of two columns of the matrix of comparative weightiness V(M,S) with index i and j for M parameters:
For clarity it is possible to print the tensor of the groups of estimations componentwise in order of the decrease all the manner of fresh difference between groups of estimations on ensemble of the diagnosed parameters. The whole component beside tensor of the groups of estimations S*S, of them S component, located on the main diagonal, are equal to zero (each groups of estimations identical to itself). Remained S*(S-1) component forms the symmetrical structure. Signifies, in component by component to printout it is enough to provide in order of the decrease S*(S-1)/2 components.
The tensor of 36 groups of estimations presents itself the matrix 36x36, defining «distances» between groups in four dimensional space of studied parameters (gr, ch, int, law), which consists of 630 different fresh differences between 36 groups of estimations.
Pair-by-pair (66 pairs) integral (on four component) of the difference between different estimation of the Russian (#R#):
For reception significant for description and interpretation result preferred to consider within the framework of each culture these 66 pairs estimation on separate typical subset. We shall consider the examples such subset.
1. The integral differences direct and three reflexive estimations, given one culture representative other cultures (in indication of the estimation NXYZ alike position: X – who values, Y – who value). We shall bring for example integral differences between estimation (direct and reflexive) of the Russian culture by Americans (AR#):
Sum: 1141
The geometric relations of three reflexive estimations on planes (three points in four dimensional space) possible present in the manner of «Triangle reflexive estimation Russian culture by Americans»:
But if return to the matrix of comparative weightiness, that each of four estimations (one straight line and three reflexive) is characterized peculiar by psychological portrait within the framework of studied four parameters. Herewith psychological portrait each of 36 groups of estimations is considered in united system, with the general beginning of the coordinates – a level zero of comparative weightiness. We shall bring for example psychological portraits groups of estimations of Russian culture on direct and reflexive estimations made by Americans:
2. The subset definied by pair of ethnic groups, which give the estimation of the third ethnic group. When considering three cultures such subset will be nine. We shall provide in quality of the example pair (16 pairs) integral (on four components) of the difference between estimation (direct and reflexive) of the Russian culture, made by Russians and Americans (RR# and AR#):
3. The last from proposed for description and analysis subset – a collation of appraisers in four dimensional space of studied parameters. Positions are now permanent in denotation of estimation of NXYZ: Y – who is estimated, Z – from whose point of view estimate, and positions are varied: X – who estimates. As a result we have four triangles at the evaluation of every culture (one with by lines and three with identical (on position of Z) reflection estimations). For an example will bring reflection estimations over of the Russian culture from point of Americans:
Introduce the informative as well as results total difference reflexive estimation: summation over six numbers fresh difference estimation, direct and reflexive, on four studied parameters (in brought above example =1141).
As a result we have total measures of «variability» of reflection for the pairs of XY, where X – who estimates, Y – who is estimated (matrix 3x3). It is further possible to estimate for the matrix of total measures of «variability» (matrix 3x3) of sum to column-wise (second position) – who is estimated (the estimated) and on lines (first position) – who estimates (appraisers).
In conclusion we will consider selected 36 groups of reflection estimations through the «Levels of Extreme Values» groups of Rj, which are sums of absolute values of elements of columns of matrix of comparative weightiness:
The size of Rj determines in number a prevailing level in the extremes of comparative display of the studied parameters of j-group of estimations above other examined groups of estimations on a great number simultaneously of all of the studied parameters. It is useful to divide 36 direct and reflection estimations (denotation of NXYZ) into nine groups depending on what culture (Russian, American, Indian) is estimated (Y) and who estimates it (X). Below for an example resulted extreme values (one of nine blocks) evaluation of the culture Russians:
There are of interest (as well as for the total differences of reflection estimations) different intermediate results of adding up of extreme values: who estimates and who is estimated. As a result we have total measures of extreme values of reflection representations for the pairs of XY, where X – who estimates, Y – who is estimated (matrix 3x3). It is further possible to estimate for the matrix of total measures of extreme values (matrix 3x3) sum to column-wise (second position) – who is estimated (the estimated) and on lines (first position) – who estimates (appraisers).
We will mark in conclusion, that the offered method of research of ethnic groups will be given more complete and structured picture of representation of different cultures about each other and about itself.
 . It is supposed that dispersion


 ,
, ,
,
 ,
,